
Sign in into control panel and create a new project.
Add metrics and select blocks to display on the dashboard.
Add a link to the dashboard on your web site.

Add incidents and update their statuses.
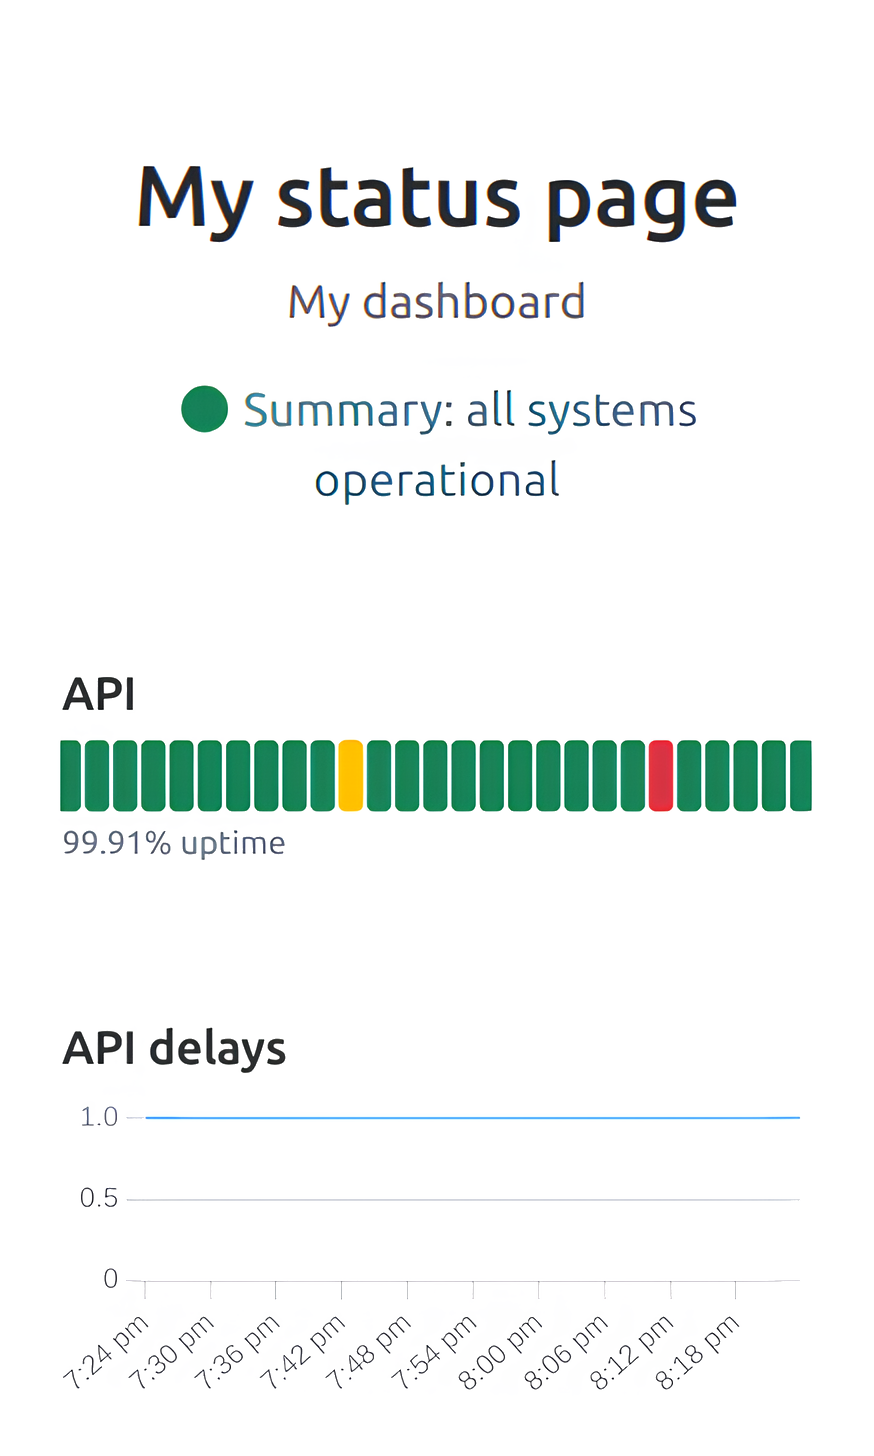
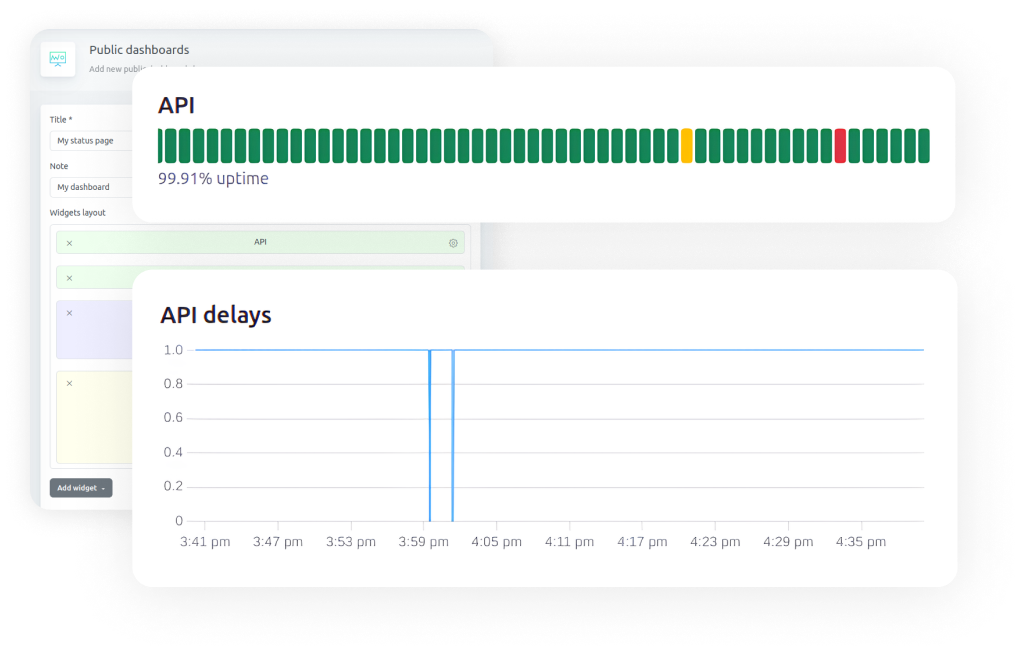
Uptime is determined based on incidents.
Add metrics to be collected automatically to monitor the performance of your resources.
Set up dashboards easily, and save time for important tasks.
Monitoring of any urls including urls with Prometheus metrics.
Feel free to reach out with your questions and suggestions!
For big teams working on many projects
Medium companies
For growing teams
Public dashboard
The public dashboard is designed to share the status of your project with your clients. It provides information on whether your services are currently operational and displays the history of incidents.
In contrast, private dashboards are intended for exclusive use within your team. But technically, they are identical to public dashboards.
HTTP metrics are the simplest type of metric available in Isitrun. To set them up, simply specify the URL whose availability you want to check, and define what constitutes a successful check. For example, you can specify that a response with an HTTP status code of 200 is considered successful, or you can indicate a specific expected text in the response.
Prometheus metrics are a set of metrics formatted according to the
Prometheus specification, accessible via a specified URL.
Here’s an example
of such metrics, which includes two metrics:
isitrun_dashboard_latency_ms and isitrun_status_api_latency_ms.
# HELP isitrun_dashboard_latency_ms Time taken to open the dashboard
# TYPE isitrun_dashboard_latency_ms gauge
isitrun_dashboard_latency_ms 357
# HELP isitrun_status_api_latency_ms Time taken to open the Isitrun status API endpoint
# TYPE isitrun_status_api_latency_ms gauge
isitrun_status_api_latency_ms 77
We accept all major credit cards, including Visa, MasterCard, Discover, American Express, and UnionPay.
No contracts, no hidden fees, and no setup charges. You can change your plan or cancel your Isitrun subscription at any time.
Do you need any more information? Contact us